Debugging Magento REST API using Phpstorm and Xdebug
In this tutorial, I will demonstrate how to debug remote REST API calls that are implemented with PHP. That is, I will show you how to run the debugger through the code that is called by the REST API.
In this specific tutorial, the demonstration will be done on Magento 2. However, it is applicable to any other platform that uses PHP to call and to implement the REST API calls.
In this tutorial, I am using Ubuntu 16.04, PHP 7.0.33, Xdebug 2.4.o and Phpstorm 6.0.3.
Step 1: Configuring Xdebug
In this tutorial, I assume that you’ve installed Xdebug on your server.
To check if your Xdebug is installed, run php -v in your SSH, and check that the output has the xdebug string in it. For example, this is what I get when I run php -v:
PHP 7.0.33-0ubuntu0.16.04.2 (cli) ( NTS )
Copyright (c) 1997-2017 The PHP Group
Zend Engine v3.0.0, Copyright (c) 1998-2017 Zend Technologies
with Zend OPcache v7.0.33-0ubuntu0.16.04.2, Copyright (c) 1999-2017, by Zend Technologies
with Xdebug v2.4.0, Copyright (c) 2002-2016, by Derick Rethans
If you don’t get the Xdebug in the output message, you either haven't installed it or haven't enabled it. I won’t cover here how to install Xdebug, but there are tons of great tutorials about that over the internet.
Assuming that your Xdebug is installed and enabled, open the xdebug apache configuration file. On my server (Ubuntu 16.04 with PHP 7.0.33) it is located at /etc/php/7.0/apache2/conf.d/20-xdebug.ini
Make sure that it has the following content:
zend_extension=/usr/lib/php/20151012/xdebug.so
xdebug.remote_enable=1
xdebug.remote_port=9001
xdebug.remote_host=192.168.1.12
Where 192.168.1.12 is the local IP address of the computer where the Phpstorm is running. If your Phpstorm is running on Windows, you can check your IP address by running ipconfig in the Windows shell.
I’ve set 9001 as a remote_port, because the standard port 9000 is often being used by other applications.
After saving the configuration files, restart apache. If you are on Ubuntu, it can be done by running service apache2 restart
Step 2: Setting a XDEBUG_SESSION cookie to your REST client
In order for the Xdebug to pick up your session, you need to set the XDEBUG_SESSION cookie in the client that you use to make your API calls. I use Zend Http client. So my code looks something like that:
$client = new Client();
$client->setEncType(Client::ENC_FORMDATA);
$options = [
'adapter' => 'Zend\Http\Client\Adapter\Curl',
'curloptions' => [
CURLOPT_FOLLOWLOCATION => true,
CURLOPT_SSL_VERIFYPEER => false,
CURLOPT_SSL_VERIFYHOST => false
],
'maxredirects' => 0,
'timeout' => 30
];
$client->setOptions($options);
$client->setCookies(['XDEBUG_SESSION' => '16045']);
$response = $client->send($request);
$body = $response->getBody();
(The number 16045 is arbitrary.)
Step 3: Uploading the PHP file where you are making the API call to the root Magento directory
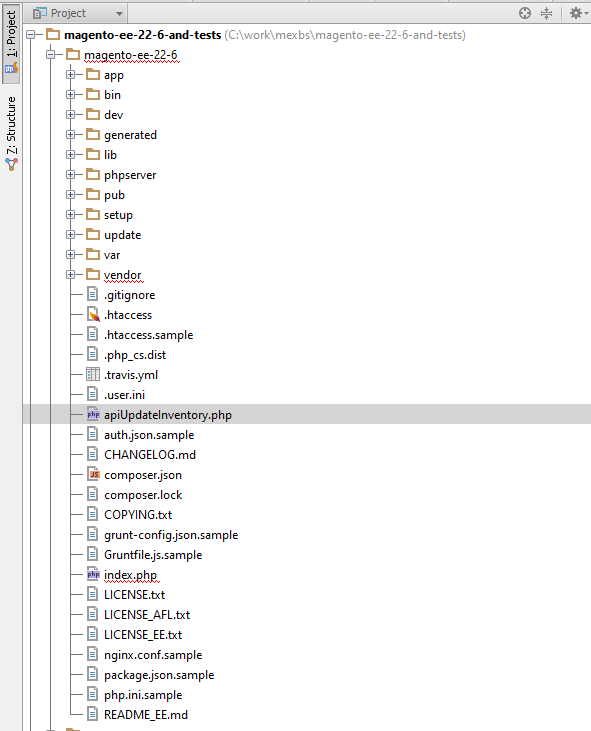
Upload the file where you are making the API calls to the Magento root directory. In my example, it is the file apiUpdateInventory.php.
Here is my Project structure in Phpstorm:

Step 4: Setting the debugging port in Phpstorm
In my example, I use the port 9001 in the server configuration, so I need to set it as the debugging port in Phpstorm. To do that, go to Phpstorm → Settings → PHP → Debug, and under xdebug, set the Debug port to 9001 (or any other port that you’ve set in the xdebug configuration file in Step 1).
Step 5: Turning on the Debug Connection Listener in Phpstorm
In Phpstorm, click on the phone icon next to the debugging section on the top, and make sure that it is green, like in the following screenshot:

Also, don’t forget to set some breakpoints (in the file that makes the API call, as well as in the file that implements the API call), or to click on “Run → Break at first line in PHP scripts” in Phpstorm.
Step 5: Running the PHP script that calls the API
To run the script, in your favorite browser, surf to <your_website_url>/<the_PHP_file_that_makes_the_API_call>?XDEBUG_SESSION_START=16045
In my example it is https://www.magento-ee-22-6.local/apiUpdateInventory.php?XDEBUG_SESSION_START=16045
Step 6: Debugging the API!
This is where the magic happens - in the second you run your script (in Step 5), the debugging of the PHP script that makes the API call should trigger automatically in your Phpstorm. When the debugger reaches the line that makes the actual API call, it should get stuck, while the status should be “Connected”. Then you should click on the red square to stop the debugging, and then the debugger will popup in the code that implements the API! Yaaay!
Here is a screen recording where I do exactly what I just described - I run the debugger, stop it in the line that calls the API , and it proceeds to the file that implements the API call (in my case it is the UpdateInventory::save() function) -

Summing up
After reading this tutorial, you should be able to debug your API calls with Phpstorm and Xdebug. If you have any questions - please write me in comments!

